.png)


.jpg)
.jpg)
.jpg)

STREAKING MEASUREMENT TEST CHART
- Introduction
- Product Software
STREAKING MEASUREMENT TEST CHART
REFLECTANCE
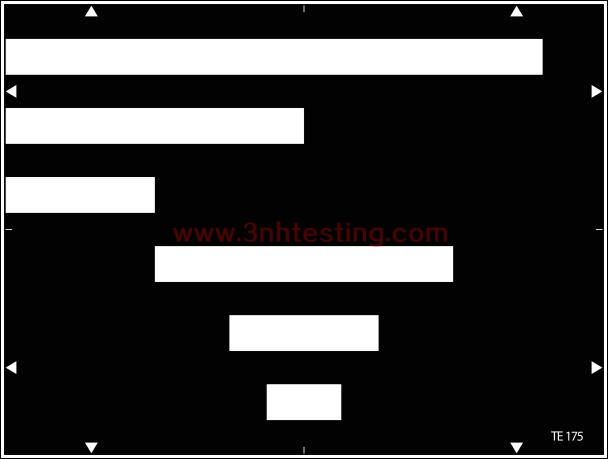
The TE175 is designed for measurement of the disturbance caused by the video
level in black areas to the right of or below the areas. Horizontal white lines are
positioned on a black background.
Definition of streaking measurements
Measurement of the disturbance caused by the video level in black areas to the
right of or below the areas.The disturbance is characterized by measuring the
duration of the delay before the video level corresponding to the normal video
level of the black is restored.
Measuring equipment
Video level meter; B/W monitor, oscilloscope, low-pass filter: 500 KHz
Measurement conditions
The chart illumination must be adjusted so that the white bars give a signal of
100% with average iris setting.
Gain: 0dB
Gamma corrector: OFF
Contour corrector: OFF
Knee corrector: OFF
Pedestal = 5% of nominal video level (= 35 mV)
Measurement procedure
The lines crossing the white lines are displayed on the oscilloscope and a
measurement is made at the R, G, B outputs. The measurement is repeated at
various taking account of the nature of the streaking observed on a control monitor.
In order to distinguish the effects of flare from the effects of streaking, a different
measurement may be made taking as reference the number of lines not crossing
the white surface which are affected only by flare.
Presentation of results
Worst peak deviation of black level in the streak compared with an adjacent black
outside the streak. Care must be taken to avoid the effect of flare from the white
bar. The result is given in percent of nominal amplitude 700 mV / 75 Ohms.
- Previous:REGISTRATION TEST CHART
Next:RESOLUTION TEST CHART
News
- 2014-06-26 3nh ISO9001 Certificate
- 2017-03-31 sales elite awards n the first quar ...
- 2014-06-26 3nh TUV Certificate
- 2024-04-29 New Guangdong ThreeNH bank account
- 2014-06-26 3nh Products Have Got CE Certificat ...
- 2014-06-12 NH Series High-Quality Colorimeter
- 2014-06-12 Colorimeters Versus Spectrophotomet ...
- 2014-06-12 Human Eyes to Distinguish Colors
