.png)


.jpg)
.jpg)
.jpg)
.jpg)
RESOLUTION TEST CHART
- Introduction
- Product Software
RESOLUTION TEST CHART
REFLECTANCE
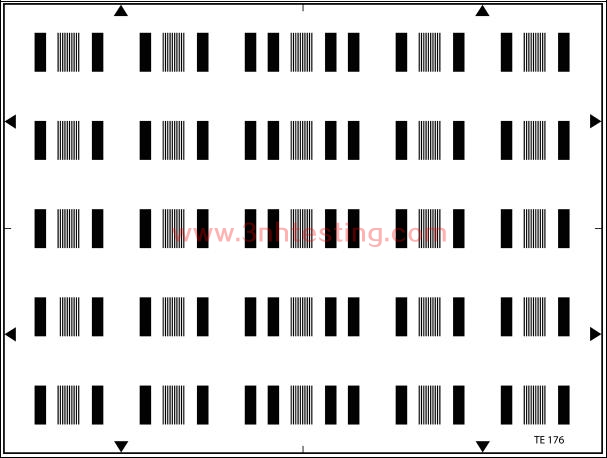
The test chart consists of alternating black and white bars with sharp transition
(3-5 micrometers). The spatial variation of the density of these bars is a rectangular function
of a cyclic ratio equal to 1. Two groups of bars with video frequencies of 0.5 and 5 MHz are
distributed over the picture area whereby the 9 outer and middle positions each are essential
for the measurements (the vertical, horizontal and diagonal axes, 10% within the extremities).
The equivalences of video and spatial frequencies are:
|
CCD format |
video frequency |
cycles / mm |
TVL / picture hight |
|
2/3 inch |
0.5 Mhz |
5.9 |
39 |
|
|
5.0 MHz |
59 |
390 |
|
1/2 inch |
|
8.1 |
39 |
|
|
|
81.2 |
390 |
Measuring equipment: Video oscilloscope or preferably video oscilloscope with memory
Measuring conditions: The camera settings must be as follows
Shading correction: ON
Aperture correction: OFF
Gamma correction: OFF
Contour correction: OFF
Color correction: OFF
Iris: F/5.6 for 2/3'' CCD, F/4for 1/2'' CCD
The test chart is evenly illuminated so that for the low frequency burst at 0.5 MHz the
amplitude of the video signal at the output of the correctly positioned and focussed
camera is 0% (0V) for the black bars and 100% (700mV / 75 Ohms) for the white bars.
Care must be taken to avoid clipping of the signal to be measured at the black and
white level. Measurements can be made on the various camera output signals, but
preferably on the Y luminance signal (or coded Y with perfect B and W balance).
The measurement is made at the center of the image but also on the edges and
at the corners so that account is taken of the lateral chromatic aberrations of
the lens. The measurements give the contrast lost of the camera response at the
value of 5 MHz. The obtained response is a contrast transfer function (CTF).
The relation to calculate the MTF according to the CTF is:
MTF(N) = π/4[CTF(N) + 1/3CTF(3N) – 1/5CTF(5N) + 1/7CTF(7N)
– 1/9CTF(9N) + 1/11CTF(11N)..]
where N is the spatial frequency of the test chart analyzed; N in TVL/H
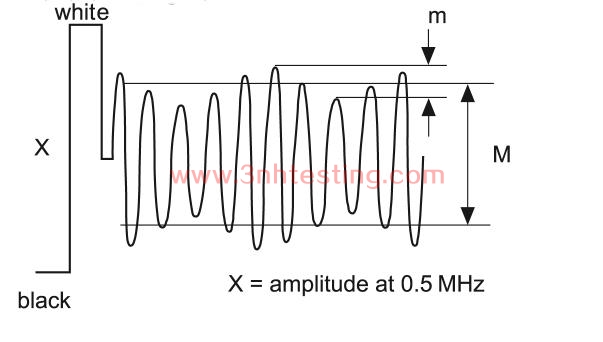
In the - probable - case of a beat affecting camera response for a given spatial frequency,
and under certain conditions only, the measured signal reassembles an
amplitude-modulated carrier signal, as shown in the following figure:
The percentage of modulation is then defined by the relation:
% mod = M / X
signal
The interference ripple bat this frequency is given by:
p% = m / M
The results of the measurement may be presented in the form of a table representing
the various areas of the image measured.
CTF Values at 5 MHz
xxx %xxx %xxx %
xxx %xxx %xxx %
xxxi %xxx %xxx %
- Previous:STREAKING MEASUREMENT TEST CHART
Next:100% WHITE TEST CHART
News
- 2015-05-08 PANTONE CU Color Card (Electronic E ...
- 2015-05-08 3nh Products FCC Certificate
- 2014-06-12 3nh Innovation from Products to Mar ...
- 2017-11-08 Attention before using T90-7 camera ...
- 2014-06-12 Colorimeters Versus Spectrophotomet ...
- 2024-04-29 New Guangdong ThreeNH bank account
- 2017-03-31 sales elite awards n the first quar ...
- 2014-06-26 3nh ISO9001 Certificate
