.png)


.jpg)
.jpg)
.jpg)
100% WHITE TEST CHART
- Introduction
- Product Software
100% WHITE TEST CHART
TRANSPARENCY
.png)
The test chart consists of a blank film between two glass panes. The (reprographic)
film is of the same material as the other ESSER TEST CHARTS transparencies
(D280, D240, D205).
The test chart is designed for shading measurement under the same lightning
conditions as other transparency measurements.
It is possible to perform shading measurements on illuminator (LG2, LE6) without
any chart. But then lightning conditions are different to other measurements with
test transparencies. By using a test transparency the light intensity of an
illuminator changes. This is caused by two superimposed factors
i the filter effect of the film and glass (25% light absorption) and
ii the light remission of the transparency ack in the illuminator
While factor a) is predominat with th LG2, the remission factor b) is
predominant with the lightning sphere LE6, i.e. the light intensity rises
significantly when a test chart is inserted. To carry out shading measurement
under the same lighting condition as other measurements the use
of the TE178 is essential.
Definition of white shading or white level uniformity
Determination of maximum white level variations in various areas of the
picture, when the camera is directed at an evenly illuminated test chart.
Measuring equipment
Oscilloscope; video amplitude meter
Measuring conditions
Gamma correction: ON
Iris aperture: F/4 2/3” CCD
Gain: 0dB
White balanced
The illumination of the test chart has to be adjusted so that the R, G, B output
signals are equal to 700mV/75ohms (nominal amplitude). Lens initially focussed
on the test chart (or an other suitable test chart e.g. TE120) and then de-focussed.
Shading correctors: ON
Zoom: Positioned to minimize the effect of vignetting and shading of the test chart.
Measuring procedures
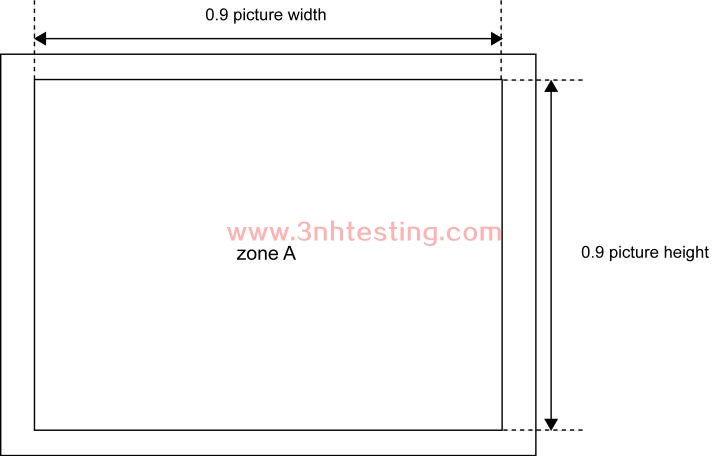
Measurements are made on the R, G, B signals at the camera output and then repeated
for two picture zones defined as follows:
xxx within a rectangular zone, the height and width of the picture (zone A)
xxxi outside this rectangle (zone B)
On the basis of these measurements, the differences of level for R-G, R-B and B-G are
calculated and the maximum peak-to-peak variantions recorded for each zone.
Presenting the results
The results, expressed in % of the nominal signal, are recorded in a table:
Non Uniformity in %
zone Azone B![]()
![]()
R
![]()
G
![]()
B
![]()
R-G
![]()
B-G
![]()
R-B![]()
- Previous:RESOLUTION TEST CHART
Next:REGISTRATION TEST CHART
News
- 2014-06-12 NH Series High-Quality Colorimeter
- 2014-06-26 3nh TUV Certificate
- 2014-06-12 Pantone TPX 2012 (175 New Colors)
- 2014-06-12 What is a colorimeter?
- 2014-06-12 Integrating Sphere
- 2014-06-12 Human Eyes to Distinguish Colors
- 2014-06-26 3nh ISO9001 Certificate
- 2014-06-12 ISO 12233 RESOLUTION TEST CHART
