.png)


.jpg)


REGISTRATION TEST CHART
- Introduction
- Product Software
REGISTRATION TEST CHART
REFLECTANCE
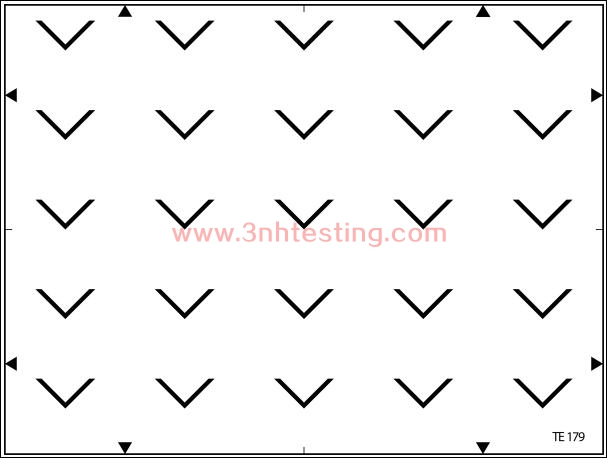
The TE179 is designed to measure fregistration of video cameras.
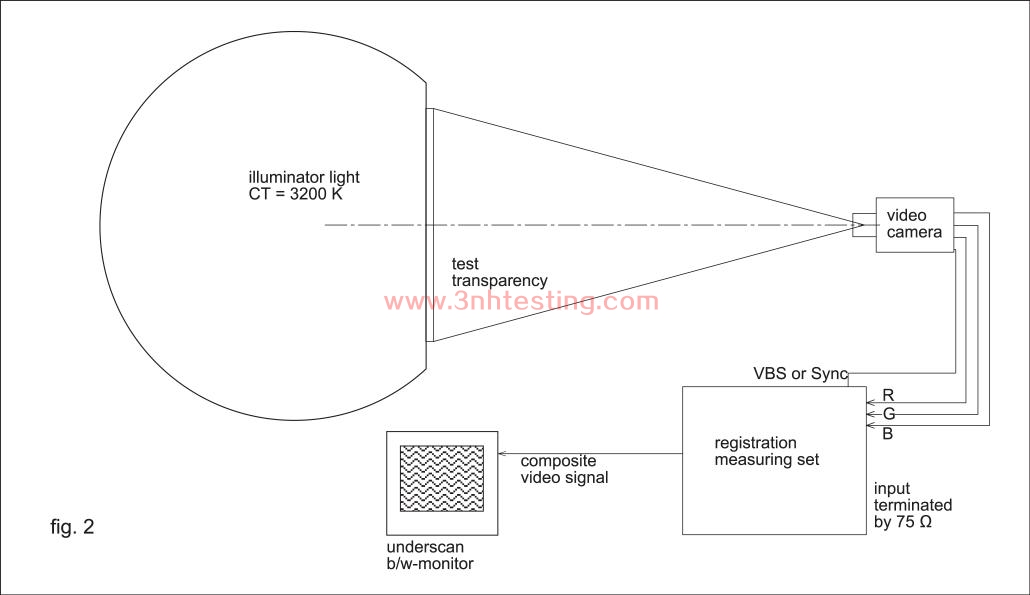
The circuit arrangement of the measurement shall be as shown in fig. 2.
If light is possible the conditions of shooting shall be as follows
1) The light density of the transparency version shall be 939 cd/m² +/- 5%
(=2000 lx) at peak white
2) The correlated color temperature of the light source shall be 3200 K +/- 100 K
3) The white balance shall be set manually or automatically to 3200 K +/- 100 K
4) The test chart shall be shot by the camera so that the frame limited by the arrows
exactly coincides with the edges of the picture displayed on the monitor in
underscan mode
5) The focus control shall be in auto or manual mode and shall be in best focus
6) The iris control shall be in auto or manual mode
7) Black level corrector „ON“
8) Flare corrector „ON“
9) Black balanced with lens capped at 35mV level
10) White balanced using the illuminator with 100% white chart at 382 cd/m² (= 1200 lx)
11) Color matrixing corrector „OFF“
12) Contour corrector „OFF“
13) Noise reducer „OFF“
14) Aperture corrector „OFF“
15) Black and white shading corrector „ON“ and optimized
16) Gamma corrector set to „1“
17) Gain control shall be set to „0 dB“
18) Optical filter, if any, shall be set to „open“ position
19) The iris shall be adjusted to attain the G-channel signal level of 70% of the
nominal signal level.
20) A horizontal line which crosses each “V“ mark shall be selected and timing
offsets against G-channel signal, a, a´-b, b´,as shown in fig. 3, shall be
measured of R-channel and B-channel signals, respectively
Horizontal and vertical displacements,H andV, shall be calculated by the following equations
H = (A+B) / 2
V = (A-B) / 2
whereA = (a+a´) / 2 and B = (b+b`) / 2
This measurments shall be conducted for each five horizontal lines which cross
over the marks.Horizontal and vertical registration errors, RH, RV, shall be
calculated as in:
RH = (H/Hr) x (4/3)
RV = (V/Hr) x (4/3)
where Hr is the horizontal sweep time
Presentation of the results
The maximum horizontal and vertical registratin errors RHmax ,RVmax in
precentage shall be reported together with teir positions as in column number-row
number. The minus signal shall precede the reported figures in case that
R-channel and B-channel signal lead the G-channel signal. The plus sign shall
be applied for the opposite case, as exempliefied for the case depicted in fig.3.
RHmax = + 0,12 % at 1 - 5
RVmax = +0,11 % at 5 - 1
The specification of the lens and its focal length shall also be reported.
Extraction of registration errors
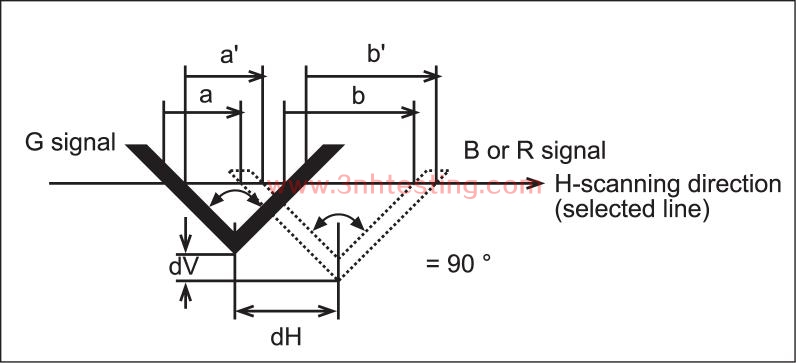
The segments a, a´-b, b´shall be considered as vectors whose origines are the selected
crossing points of the line with „V“ marks of the G-channel taken as reference is c for a,
d for a´,e for b, and f for b´as exemlified in fig. 3. As to sign of a, a´,b and b´, the direction
of the horizontal scanning is taken to be positive.
- Previous:100% WHITE TEST CHART
Next:IKEGAMI CPU - CHART
News
- 2014-06-30 NS800 Spectrophotometer CE Certific ...
- 2014-06-26 3nh ROHS Certificate
- 2017-07-08 How to use SFR resolution test char ...
- 2014-06-26 3nh Products Have Got CE Certificat ...
- 2024-03-08 New company name Guangdong ThreeNH ...
- 2017-11-08 Attention before using T90-7 camera ...
- 2014-06-12 What is a colorimeter?
- 2015-05-08 PANTONE CU Color Card (Electronic E ...
