.png)


.jpg)
.jpg)
.jpg)
REGISTRATION TEST CHART
- Introduction
- Product Software
REGISTRATION TEST CHART
REFLECTANCE

The test chart is designed for determining the relative horizontal and vertical offset which
can exist between the primary R, G, B signals.
In CCD cameras, any offset which may exist are mainly due to transversal optical
aberration as the analysers themselves, positioned with great precision by means of a
standard lens, introduce no significant offset.
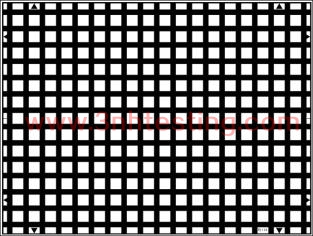
The test chart has 14 horizontal and 19 vertical black lines on a white background.
The lines have a width of 1.3% of the picture height.
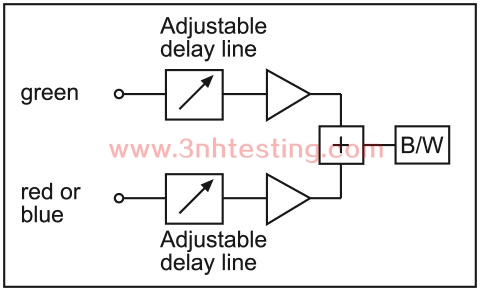
Measuring equipment
B/W monitor
Video delay, lines switchable in 10 ns steps with a total delay of more than 200 ns
Differential video amplifier
Measurement conditions
The camera setting must be as follows:
Measurements are made on the RGB output signal
Gamma correction: unimportant
Contour correction: OFF
Color correction: OFF
The RGB signal levels are set between 50% and 100%
Iris: Fully open (if one of the RGB pictures is not sharp enough then set up the iris
(F stop) to another value and refocus the lens.
Measurement procedure
The measurement equipmet is connected as follows:
It is recommended that the measurements be made with the zoom lens setting on
'wide angle' and 'tele'. In some lenses, the maximum errors in fact appear in the 'telezoom'.
With the wide angle setting, the test pattern dimensions will for example be: 800x600,
with the 'tele' setting:
400x300 ( A460: 460x345 mm).
With the camera correctly focused on the test chart and for given zoom setting, the
image is observed on a B/W monitor. By activating the delay lines, two vertical lines
of the R-G (or B-G) image are superposed in a given area of the picture. The
convergence error is then read out directly on the image defined as follow:
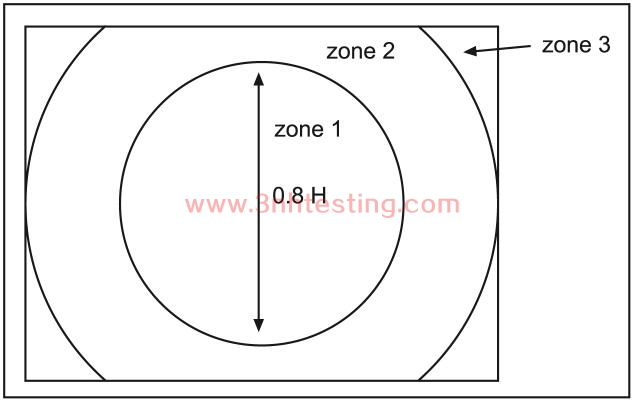
1) With a circle equal to 80% of the picture height (zone 1)
2) outside zone 1 and within a circle of a diameter equal to 100% of the picture
width (zone 2)
3) on the remnant to the picture (zone 3)
Presentation of results
For the three zones, the maximum errors measured are recorded. The results are
expressed in % of the image height and also in ns, simultaneously. Both the lens type
and zoom setting must be indicated.
|
|
R-G |
B-G |
|
R-G |
B-G |
|
R-G |
B-G |
|
Zone 1 |
x ns |
x ns |
Zone 2 |
x ns |
x ns |
Zone 3 |
x ns |
x ns |
|
|
xx % |
xx % |
|
xx % |
xx % |
|
xx % |
xx % |
- Previous:ALIASING TEST CHART
Next:STREAKING MEASUREMENT TEST CHART
News
- 2014-06-12 Human Eyes to Distinguish Colors
- 2014-06-12 3nh Innovation from Products to Mar ...
- 2014-06-12 ISO 12233 RESOLUTION TEST CHART
- 2014-06-12 The Color of Objects
- 2017-07-08 How to use SFR resolution test char ...
- 2024-04-29 New Guangdong ThreeNH bank account
- 2024-03-08 New company name Guangdong ThreeNH ...
- 2014-06-12 Colorimeters Versus Spectrophotomet ...
