.png)


.jpg)
.jpg)
.jpg)
.jpg)
ALIASING TEST CHART
- Introduction
- Product Software
ALIASING TEST CHART
REFLECTANCE
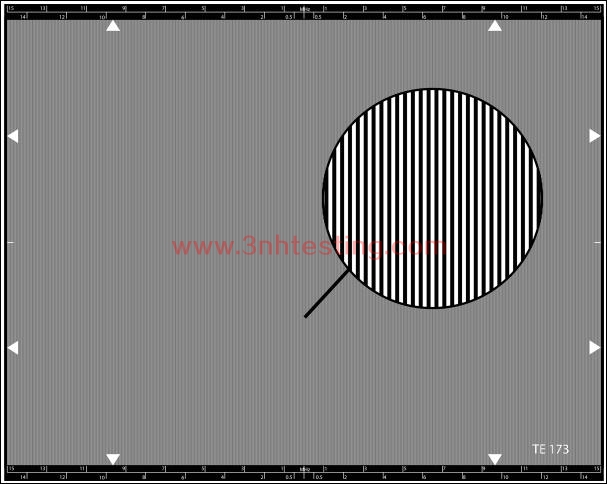
The TE173 is designed for measuring aliasing.
Aliasing effects are moiré distortions caused by interferences of two rasters. Independent
of the type of camera aliasing effects can arise by interferences of motive rasters and the
TV line structure e.g. The well known venetian blind effect or textile stripe patterns.
CCD cameras have a special immanent aliasing problem caused by the spatial image
sampling. The spectrum of the signal obtained at the camera output is compromised
of a basic spectrum repeated around multiples of the CCD sampling frequency. The
CCD sampling frequency depends on the CCD size and the number of the pixels
per CCD width. For some high spatial frequencies of the image, the condition
dictated by sampling theorem is not met, so that the basic spectrum and duplicated
spectrum can be superimposed and give rise to inter-frequency beats. The result is
moiré in the pictures.
Moiré visibility depends on the type of analyser, on the camera's low pass optical
filtering and on the spatial frequency of the test pattern analysed.
The TE173 consists of rectangular bars the spatial frequencies of which depend
on the picture width used. On the top and bottom, outside of the picture area,
horizontal lines are drawn on which are marked the framings that are to be
carried out in order to modify, by zooming, the spatial frequency seen by the camera.
Measurement procedures can be made with a spectrum analyser or a wide-band video oscilloscope.
Measurement conditions
Gamma correction: OFF
Contour correction: OFF
Colour correction: ON
Spectrum analysers measurements
The measurement principle consists in locating, on the spectral analyses of the luminance
signal Y or coded Y, and successively R, G, B; the interference lines resulting from
sampling. The camera is aligned on the test chart at a given spatial frequency. The
camera output is connected with the input of a spectrum analyser. The iris is
adjusted so, that the white level corresponds to a vision signal of 700mV / 75 Ohms.
The pedestral is set at 0mV. In case of the analyses of a signal including mixed sync
pulses, it is recommended that these pulses, which render interpretation of the spectrum
analyser curves more difficult, be suppressed. A measurement example is given in figure
2 below.
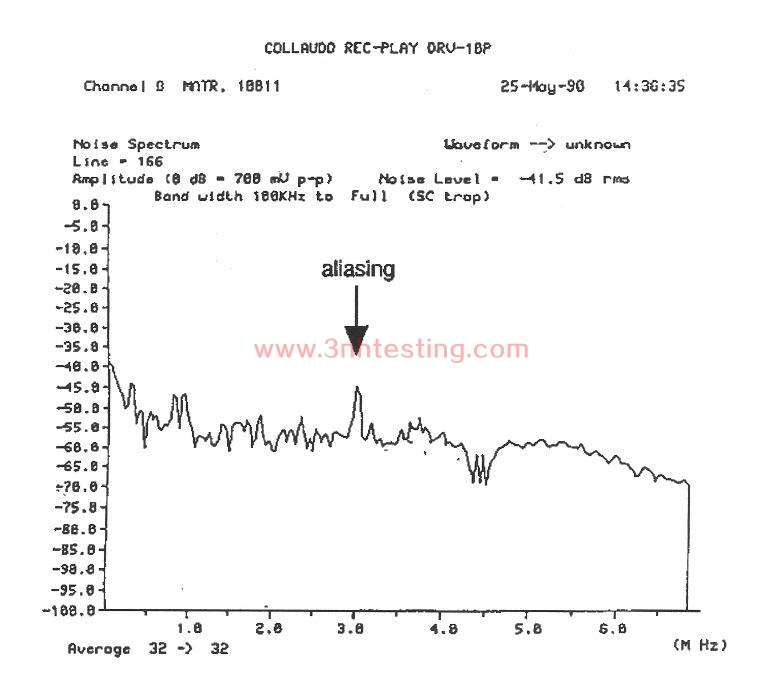
Figure 2
If the number of horizontal CCD pixels is known, it is possible to calculate the sampling
frequency, which is easily located on the analysers screen:
Sampling F (MHz) = No. of horizontal pixels / 52
The frequency of the interference line is given by the difference between the sampling
frequency and the test pattern frequency:
Interference F = Sampling F - test pattern F
The measurement involves determine the difference in level between the useful signal(s)
at test pattern frequency and the signal at interference frequency. The measurements
have to be repeated for each of the spatial frequencies and made several times
(approx. 10 times) to determine an average result.
News
- 2014-06-12 Human Eyes to Distinguish Colors
- 2014-06-26 3nh ISO9001 Certificate
- 2014-06-26 3nh TUV Certificate
- 2014-06-30 NS800 Spectrophotometer CE Certific ...
- 2014-06-12 Pantone TPX 2012 (175 New Colors)
- 2014-06-26 3nh Products Have Got CE Certificat ...
- 2014-06-12 CIE Standard Observers
- 2017-07-08 How to use SFR resolution test char ...
