.png)

.jpg)

UNIVERSAL TEST CHART
- Introduction
- Product Software
UNIVERSAL TEST CHART
REFLECTANCE
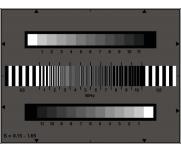
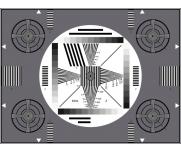
The Y05 test chart is designed for general (visual) appraisal of TV cameras.
The density of the 4 gray scales increases from D=0.15 to D=1.65 (contrast 32:1) in gradations of D=0.15. The surrounding area has
a density of D ~ 0.75.
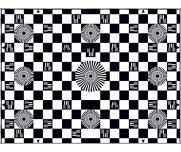
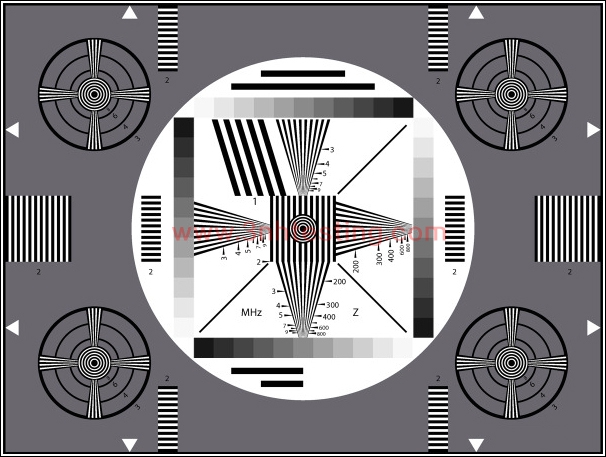
The test chart is designed primarily for orientating assessment of transmission characteristics of an electronic camera. The circular
figures enable rough appraisal of scan linearity to be made. The 2-MHz-line rasters distributed over the chart area enable surveillance
of linearity of deflection in horizontal and vertical directions. The distances between the rasters should be as equal as possible throughout.
With the aid of an oscilloscope with line selection switch, the vertical wedge-sharped rasters enable frequency response of modulation
depth to be established. The signal of the oblique 1-MHz-bars is used as reference value. The wedge rasters further enable visual appraisal
of the resolution limit to be made. In addition, cross color interferences and the effects of notch filters and comb filters can be observed.
The horizontal bars over and under the gray steps impart information on transmission characteristics in the middle frequency area (streaking).
Rough appraisal of semitone reception is possible with aid of the gray scale; exact statements are not possible due to the white surroundings.
The three diagonal lines in the gray wedge square allow line interlacing to be checked. A ladder-sharped reception of the line indicates paired lines.
- Previous:BAR TEST CHART
Next:UNIVERSAL TEST CHART TRANSPARENCY
News
- 2014-06-12 3nh Innovation from Products to Mar ...
- 2014-06-12 The Color of Objects
- 2014-06-12 Color Fastness
- 2014-06-12 Integrating Sphere
- 2014-06-12 What is a colorimeter?
- 2014-06-26 3nh ISO9001 Certificate
- 2014-06-12 NH Series High-Quality Colorimeter
- 2014-06-30 NS800 Spectrophotometer CE Certific ...

