.png)


MULTI BURST GRAY SCALE TEST CHART
- Introduction
- Product Software
MULTI BURST GRAY SCALE TEST CHART
REFLECTANCE

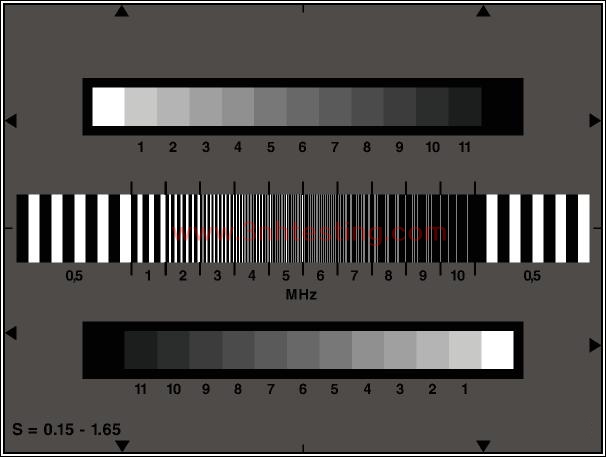
The test chart is designed for evaluation of the halftone reproduction and frequency response of the modulation depth of electronic
cameras.
In the center of a gray background (D=0.75, remission=18%) a line raster is arranged which generates frequencies of 0.5 to 10
MHz in the output signal of the camera. Above and below these black and white lines counter current gray scales are arranged.
Their calibrated gray fields 1 to 11 show the following densities and reflectance values:
|
Step |
Density |
Reflectance in % |
|
1 |
0.15 |
71.0 |
|
2 |
0.30 |
50.0 |
|
3 |
0.45 |
35.0 |
|
4 |
0.60 |
25.0 |
|
5 |
0.75 |
18.5 |
|
6 |
0.90 |
13.0 |
|
7 |
1.05 |
9.0 |
|
8 |
1.20 |
6.0 |
|
9 |
1.35 |
4.5 |
|
10 |
1.50 |
3.2 |
|
11 |
1.65 |
2.2 |
The density are based on a density of BASO4 = 0 and graduated in equal steps of 0.15. The two outer fields (0 and 12) are white
(D=0.05, reflectance=90%) and black. Due to the possibilities of reflective material this field has a lower density than the step 11 ( D ~ 1.55).
The gray scales allow the assessment of half tone reproduction. With special measuring systems (VM 700, video option,
Optest VTC 1) it is also possible to determine the gamma of the camera.

With the line rasters it is possible to determine the contrast transformation function. The reference value is the signal amplitude of
the 0.5 MHz burst. To measure the CTF ( contrast transfer function) not only in the middle but also on the upper and lower edges
the camera has to be swiveled downwards and upwards. Care must be taken to avoid clipping of the signal to be measured at the
black and white level.
Measurement procedures
Measurement can be made on the various camera output signals, but preferably on the Y luminance signal (or coded Y with perfect
B and W balance). The measurement is made at the center of the image and the corners so that the account is taken of the lateral
chromatic aberration of the lens. In addition to determining camera response to the particular value of 5 MHz, measurement of the
response at the other frequencies serves to plot a curve giving contrast loss (or modulation) according to the spatial frequency of
the test chart analyzed. Frequency bursts of 0.5 MHz and 1 to 7 MHz are recommended for this measurement. The measurements
give the CTF.
Mathematical relations can be used to calculate the MTF according to the CTF values:
MTF(8N)= π /4 [CTF(N) + 1/3 CTF(3N ) - 1/5 CTF(5N) + 1/7 CTF(7N) - 1/9 CTF(9N) + 1/11 CTF(11N)...]
where N is the spatial frequency of the test chart analyzed; N in TVL/ H
- Previous:CHESSBOARD TEST CHART
Next:MULTI BURST GRAY SCALE TEST CHART
News
- 2014-06-12 Integrating Sphere
- 2014-06-26 3nh ISO9001 Certificate
- 2017-07-08 How to use SFR resolution test char ...
- 2014-06-30 NS800 Spectrophotometer CE Certific ...
- 2014-06-26 3nh TUV Certificate
- 2014-06-26 3nh Products Have Got CE Certificat ...
- 2014-06-12 3nh Innovation from Products to Mar ...
- 2017-06-27 Definition and formation of pixel n ...
