.png)

Recommend Products
.jpg)
.jpg)
.jpg)
.jpg)
.jpg)
Contact Us
Address: 6-8/F,Building B33,Low-Carbon Headquarters Park,400 Xincheng Avenue,Zengcheng District,Guangzhou,P.R.China.
Service Hotline: 400-666-2522
Tel: +86 13510845302
Whatsapp:13510845302
wechat:13510845302/Li_3nh
Email:sales0026@3nh.com
QQ: 2976464251
Skype: +8613510845302
Website: www.3nhtesting.com
You Are Here : Home >> Products >> Image test chart >> Esser Test Chart
>> TEST CHART FOR RADIAL RESOLUTION
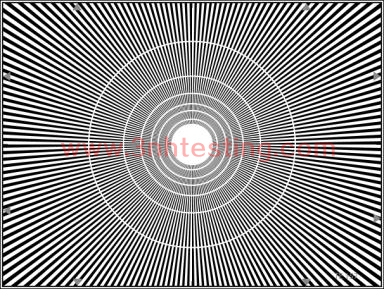
TEST CHART FOR RADIAL RESOLUTION
The test chart shows a sector star with 180 sectors. One sector corresponds to an angel of 2° and has a black and a white beam.
Date:2017-08-10 Browse:
- Introduction
- Product Software
TEST CHART FOR RADIAL RESOLUTION
REFLECTANCE
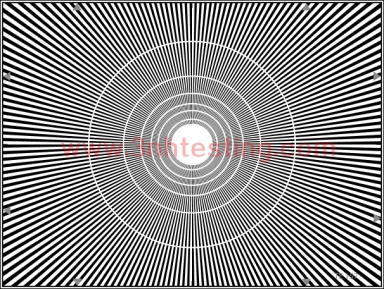
The test chart shows a sector star with 180 sectors. One sector corresponds to an
angel of 2° and has a black and a white beam.
The center of the sector star shows a white circular area. At the edge of this core
the sector width corresponds to a frequency of 10 MHz with reference to the width
of the test chart (marked by the gray arrows). Additional white concentric circles mark
(on the outer edge) the following frequencies: 8, 6, 5, 4, 3 and 2 MHz.
- Previous:WINDOW TEST CHART 1%
Next:CINE TEST CHART
News
- 2014-06-26 3nh ISO9001 Certificate
- 2014-06-12 NH Series High-Quality Colorimeter
- 2014-06-26 3nh Products Have Got CE Certificat ...
- 2014-06-12 The Color of Objects
- 2014-06-12 Colorimeters Versus Spectrophotomet ...
- 2014-06-12 Color Fastness
- 2017-06-27 Definition and formation of pixel n ...
- 2017-03-31 sales elite awards n the first quar ...
