.png)

Recommend Products


Contact Us
Address: 6-8/F,Building B33,Low-Carbon Headquarters Park,400 Xincheng Avenue,Zengcheng District,Guangzhou,P.R.China.
Service Hotline: 400-666-2522
Tel: +86 13510845302
Whatsapp:13510845302
wechat:13510845302/Li_3nh
Email:sales0026@3nh.com
QQ: 2976464251
Skype: +8613510845302
Website: www.3nhtesting.com
You Are Here : Home >> Products >> Image test chart >> Esser Test Chart
>> CAMCORDER RESOLUTION TEST CHART
CAMCORDER RESOLUTION TEST CHART
The TE144 was developed in a private German testing laboratory and serves particularly for evaluating the frequency response of consumer camcorders.
Date:2017-08-01 Browse:
- Introduction
- Product Software
CAMCORDER RESOLUTION TEST CHART
REFLECTANCE

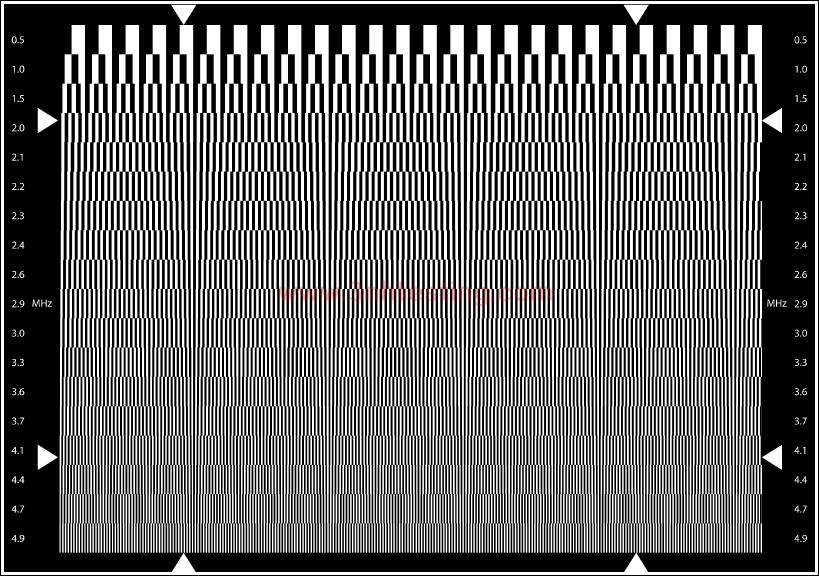
The TE144 was developed in a private German testing laboratory and serves particularly for
evaluating the frequency response of consumer camcorders.
The test chart is subdivided into 18 horizontal fields of bar patterns with different frequencies.
The upper field has a frequency of 0.5 MHz and serves as a reference value. The following
fields have the frequencies:
1.0, 1.5, 2.0, 2.1, 2.2, 2.3, 2.4, 2.6, 2.9, 3.0, 3.3, 3.6, 3.7, 4.1, 4.4, 4.7, 4.9 MHz
The frequencies are marked on the left and right margins of the image.
- Previous:ISO TEST PATTERN
Next:TEST SIGNAL TEST CHART – LINE 17
News
- 2014-06-26 3nh ROHS Certificate
- 2014-06-12 3nh Innovation from Products to Mar ...
- 2015-05-08 PANTONE CU Color Card (Electronic E ...
- 2014-06-12 Pantone TPX 2012 (175 New Colors)
- 2014-06-12 CIE Standard Observers
- 2014-06-12 NH Series High-Quality Colorimeter
- 2017-07-08 How to use SFR resolution test char ...
- 2014-06-12 ISO 12233 RESOLUTION TEST CHART
