.png)

Recommend Products


Contact Us
Address: 6-8/F,Building B33,Low-Carbon Headquarters Park,400 Xincheng Avenue,Zengcheng District,Guangzhou,P.R.China.
Service Hotline: 400-666-2522
Tel: +86 13510845302
Whatsapp:13510845302
wechat:13510845302/Li_3nh
Email:sales0026@3nh.com
QQ: 2976464251
Skype: +8613510845302
Website: www.3nhtesting.com
You Are Here : Home >> Products >> Image test chart >> White Balacing Test Chart
>> WHITE BALANCE CHART (70% REMISSION)
.jpg)
WHITE BALANCE CHART (70% REMISSION)
The TE115 chart is designed for white balance. The density of the white area is 0.15 (based on BaO 4S=0). This corresponds to a remission of 70%.
Date:2017-07-14 Browse:
- Introduction
- Product Software
WHITE BALANCE CHART (70% REMISSION)
REFLECTANCE
.jpg)
The TE115 chart is designed for white balance. The density of the white area is 0.15 (based on
BaO 4S=0). This corresponds to a remission of 70%.
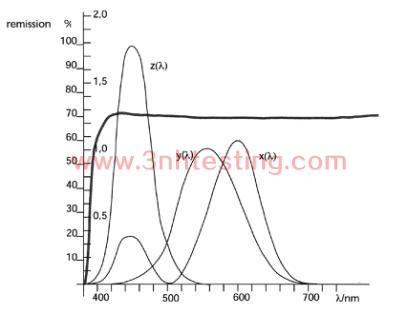
The material which is used for the white chart shows high homogeneity of the remission in the
visible spectrum of 380 to 700nm (see gray curve in the illustration). In the area below 420 the
remission shows a steep decrease. In this area the sensitivity of the blue and red functions is
so low, that the light reflected is not transformed significantly.
- Previous:ZONE PLATE TEST CHART
Next:HDTV GRID / REGISTRATION TEST CHART
News
- 2014-06-12 Color Fastness
- 2014-06-12 Colorimeters Versus Spectrophotomet ...
- 2024-04-29 New Guangdong ThreeNH bank account
- 2014-06-12 Human Eyes to Distinguish Colors
- 2014-06-26 3nh Products Have Got CE Certificat ...
- 2014-06-12 Integrating Sphere
- 2017-11-08 Attention before using T90-7 camera ...
- 2017-07-08 How to use SFR resolution test char ...
