.png)


UNIVERSAL TEST CHART
- Introduction
- Product Software
UNIVERSAL TEST CHART
REFLECTANCE

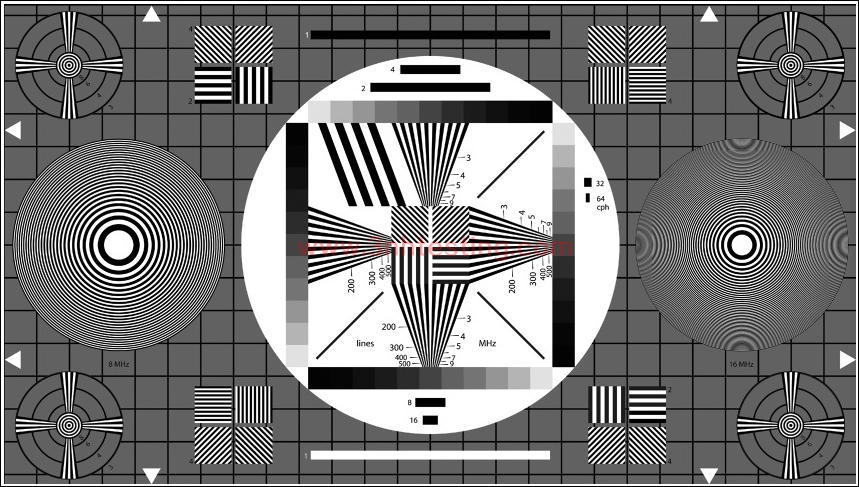
The TE105 test chart is designed for general (visual) appraisal of 16:9 TV cameras.
The density of the 4 gray scales increases from D=0.15 to D=1.65. The integrated 25/15 grid
corresponds to that of an electronic grid generator.
The test chart is designed primarily for orientating assessment of transmission characteristics
of an electronic camera. The circular figures and the grid allow a rough appraisal of the
geometry. 2 MHz and 4 MHz line rasters are distributed over the image area, the 4 MHz
rasters being inclined in angles of 45° and 135°to the horizontal line.
With the aid of an oscilloscope with line selection switch, the wedge-shaped vertical rasters
enable the frequency response of the modulation depth to be determined. The signal of the
oblique 1 MHz bars is used as reference value. The wedge-shaped line rasters further
enable visual appraisal of the resolution limit to be made. In addition, cross-color interferences
and the effects of notch filters and comb filters can be observed.
The horizontal bars located above and below the gray scales impart information on
transmission characteristics in the medium frequency are (streaking). Rough appraisal of
half-tone reproduction is possible with the aid of the gray scale; exact statements are,
however, not possible due to the white surroundings.
The three diagonal lines inside the square of gray scales allow line interlacing to be checked.
A ladder-shaped reception of the lines indicates paired lines. On the left and right sides two
zone plates are located, the left one reaching a local frequency of 8, the right one of 16
MHz. The zone plates serve to determine the following characteristics of TV cameras and
TV transmission systems:
• resolution in horizontal, vertical and diagonal direction
• resolution depending on the location of scanning
• effect of horizontal and vertical aperture corrections
• effects of interference between the zone plate and television raster resp. the shadow
mask structure of color picture tubes
reaction during horizontal and vertical movement of the camera (or the test chart): dynamic
resolution, temporary disturbance
- Previous:MULTI BURST TEST CHART
Next:COLOR BAR TEST CHART 16:9
News
- 2014-06-12 CIE Standard Observers
- 2014-06-26 3nh Products Have Got CE Certificat ...
- 2014-06-26 3nh TUV Certificate
- 2017-07-08 How to use SFR resolution test char ...
- 2014-06-12 3nh Innovation from Products to Mar ...
- 2014-06-12 Colorimeters Versus Spectrophotomet ...
- 2014-06-12 The Color of Objects
- 2014-06-12 Integrating Sphere
