.png)


EIAJ TEST CHART A / ITE RESOLUTION CHART
- Introduction
- Product Software
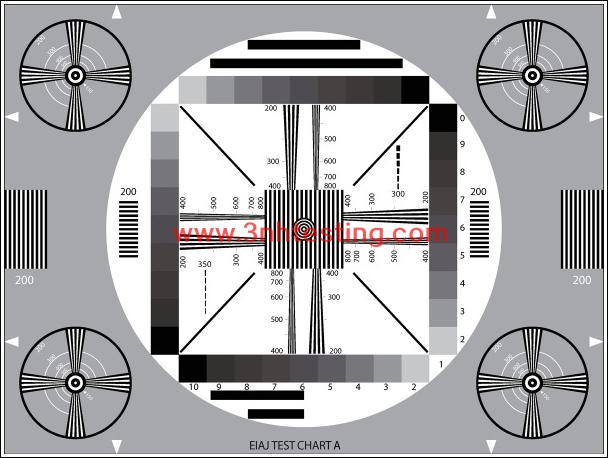
EIAJ TEST CHART A / ITE RESOLUTION CHART
REFLECTANCE
The YE95 test chart is designed for general (visual) appraisal of electronic cameras.
The density of the 4 gray scales increases from D ≈ 0.15 (picture white = 1 step) to D ≈ 1.50
(contrast 22:1) in gradations of D ≈ 0.15. The surrounding area has a density of D ≈ 0.25
(reflectance = 57%) .
The test chart is designed primarily for orientating assessment of transmission
characteristics of an electronic camera.
The circular figures enable rough appraisal of scan linearity to be made. The multi
burst of 200 lines, distributed over the chart area enables surveillance of linearity of
deflection in horizontal and vertical directions. The distances between the black an
white lines should be as equal as possible throughout.
With the aid of an oscilloscope with line selection switch, the vertical
wedge-sharpedrasters enable frequency response of modulation depth to be
established. The signal of the 200 lines-bars is used as reference value. The
wedge rasters further enable visual appraisal of the resolution limit to be made.
In addition, cross color interferences and the effects of notch filters and comb
filters can be observed.
The horizontal bars over and under the gray steps impart information on transmission
characteristics in the middle frequency area (streaking). Rough appraisal of semitone
reception is possible with aid of the gray scale; exact statements are not possible
due to the white surroundings.
The four diagonal lines in the gray wedge square allow line interlacing to be checked.
A ladder-sharped reception of the line indicates paired lines.
News
- 2017-07-08 How to use SFR resolution test char ...
- 2014-06-12 The Color of Objects
- 2014-06-12 Color Fastness
- 2017-03-31 sales elite awards n the first quar ...
- 2014-06-26 3nh ISO9001 Certificate
- 2014-06-26 3nh ROHS Certificate
- 2024-04-29 New Guangdong ThreeNH bank account
- 2017-06-27 Definition and formation of pixel n ...
