.png)


HDTV ZONE PLATE TEST CHART
- Introduction
- Product Software
HDTV ZONE PLATE TEST CHART
REFLECTANCE
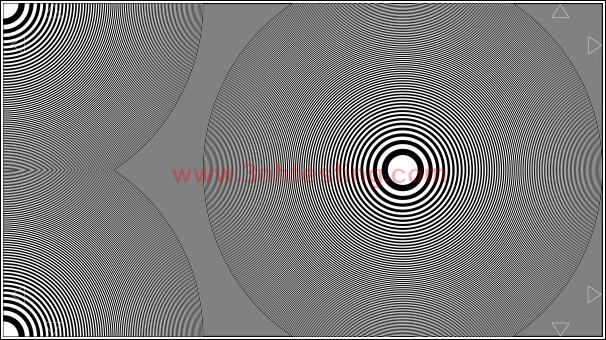
The zone plate test chart shows asymmetrically arranged one zone plate ranging from 0 to 600
cph (cycles per height) and two zone plate sectors with their centers located in the left corners.
The gore-shaped gaps are gray (D = 0.75). The black frame has markings in 100 cph steps. To
show the complete figure of the zone plate sectors keeping the scaling constant, the test chart
is wider on the left side than the proportionate of the 16:9 ratio. The 16:9 format is marked by
white arrows which are about 5.5 mm inside the edge.
The zone plate test chart is particularly suited for the visual determination of the resolution of
a high definition camera. It has to be generally taken into account that also the monitor has a
decisive influence on the modulation transfer. Comparing several or different cameras on the
same monitor is nevertheless very easy. The overall transfer function of camera, transmission
link and monitor can be measured by means of the scaling.
When testing valve cameras the distinct anisotropy of the transfer function, i.e. the differing
resolution depending on the direction of the line rasters, can be evaluated: not only the horizontal
resolution is different from the vertical resolution but also in both diagonal directions the resolution
is generally differing. Horizontal resolution is frequently limited to a large extent by the low pass
characteristics of the transmission link (not least for reasons of noise reduction). Diagonal
resolution is distorted due to the characteristics of electronic beam scanning. This does not
apply to CCD-cameras.
The video signal at the camera output can be used for measuring the modulation transfer
function. The amplitude of the video signal is determined by means of an oscilloscope with
as ideal a lighting of the test chart as possible. The oscilloscope then has to be triggered
precisely to a picture line, the vertical part being inside a linear function of the time. In order
to reach a better evaluation of these measurements the gamma distortion of the camera has
to be switched off, i.e. measurements are made in linear operation.
Measurements in the video signal are not only independent of the transfer function of the
monitor, but it is also possible to reach more detailed quantitative information about the
transmission characteristics of the camera compared to visual determination of the resolution
limit. This allows for example, to determine the 3 dB-point of the transfer function. For a
more precise theoretical approach the difference of modulation transfer function (MTF)
and contrast transfer function (CTF) has to be considered: as the picture does not show
a sinusoidal contrast distribution with half tones the signal includes the uneven harmonics
of the fundamental frequency, and measurements by oscilloscope at first any lead to
statements on the CTF of the camera which can be converted into the MTF.
News
- 2015-05-08 PANTONE CU Color Card (Electronic E ...
- 2014-06-12 What is a colorimeter?
- 2014-06-26 3nh Products Have Got CE Certificat ...
- 2024-04-29 New Guangdong ThreeNH bank account
- 2014-06-12 Colorimeters Versus Spectrophotomet ...
- 2015-05-08 3nh Products FCC Certificate
- 2014-06-12 Integrating Sphere
- 2014-06-30 NS800 Spectrophotometer CE Certific ...
